Long Island • New York
Massapequa
Real Estate. The South Shore, at Its Best Address
Homes in Massapequa sold at a median of
$818,500
across 383 closed sales in the twelve months to July 2026, up 7.3% on a year earlier.
Measured separately, Massapequa (School District) reads $870,000 across 333 closed sales in the twelve months to July 2026, up 10.5% on a year earlier.
From $415,000 in January 2013 to $818,500 in July 2026. The dashed line is Massapequa (School District).
| Year | Massapequa |
|---|---|
| 2013 | $380,000 |
| 2014 | $420,000 |
| 2015 | $440,000 |
| 2016 | $465,000 |
| 2017 | $478,750 |
| 2018 | $519,000 |
| 2019 | $530,000 |
| 2020 | $555,000 |
| 2021 | $607,000 |
| 2022 | $655,250 |
| 2023 | $675,000 |
| 2024 | $749,000 |
| 2025 | $799,500 |
| 2026 | $818,500 |
As of July 2026 · Rolling 12 months, single family · Source: OneKey® MLS
- Days on Market
- 19median, listing to contract
- Months Supply
- 2.5inventory at the current pace
- Of Original List
- 102.8%median share of the first asking price
- Price / sq ft
- $499median, finished space
20 of the 383 homes sold in the twelve months to July 2026 fell in the top band, $1,500,000 or More, at a median of $1,667,500 and $577 per square foot.
- $1,500,000 or More20$577 per square foot · 20 median days to contract
- $1,000,000 to $1,499,99956$509 per square foot · 25 median days to contract
- $750,000 to $999,999186$485 per square foot · 19 median days to contract
- $749,999 or Less121$525 per square foot · 17 median days to contract
| Price band | Closed sales | Share of sales | Median price | Median $/sq ft | Median days on market | Months supply | % of original list |
|---|---|---|---|---|---|---|---|
| $1,500,000 or More | 20 | 5.2% | $1,667,500 | $577 | 20 | 7.5 | 100.0% |
| $1,000,000 to $1,499,999 | 56 | 14.6% | $1,200,000 | $509 | 25 | 3.6 | 100.0% |
| $750,000 to $999,999 | 186 | 48.6% | $840,000 | $485 | 19 | 2.1 | 104.0% |
| $749,999 or Less | 121 | 31.6% | $680,000 | $525 | 17 | 1.7 | 102.9% |
As of July 2026 · Rolling 12 months, single family · Source: OneKey® MLS
About Massapequa
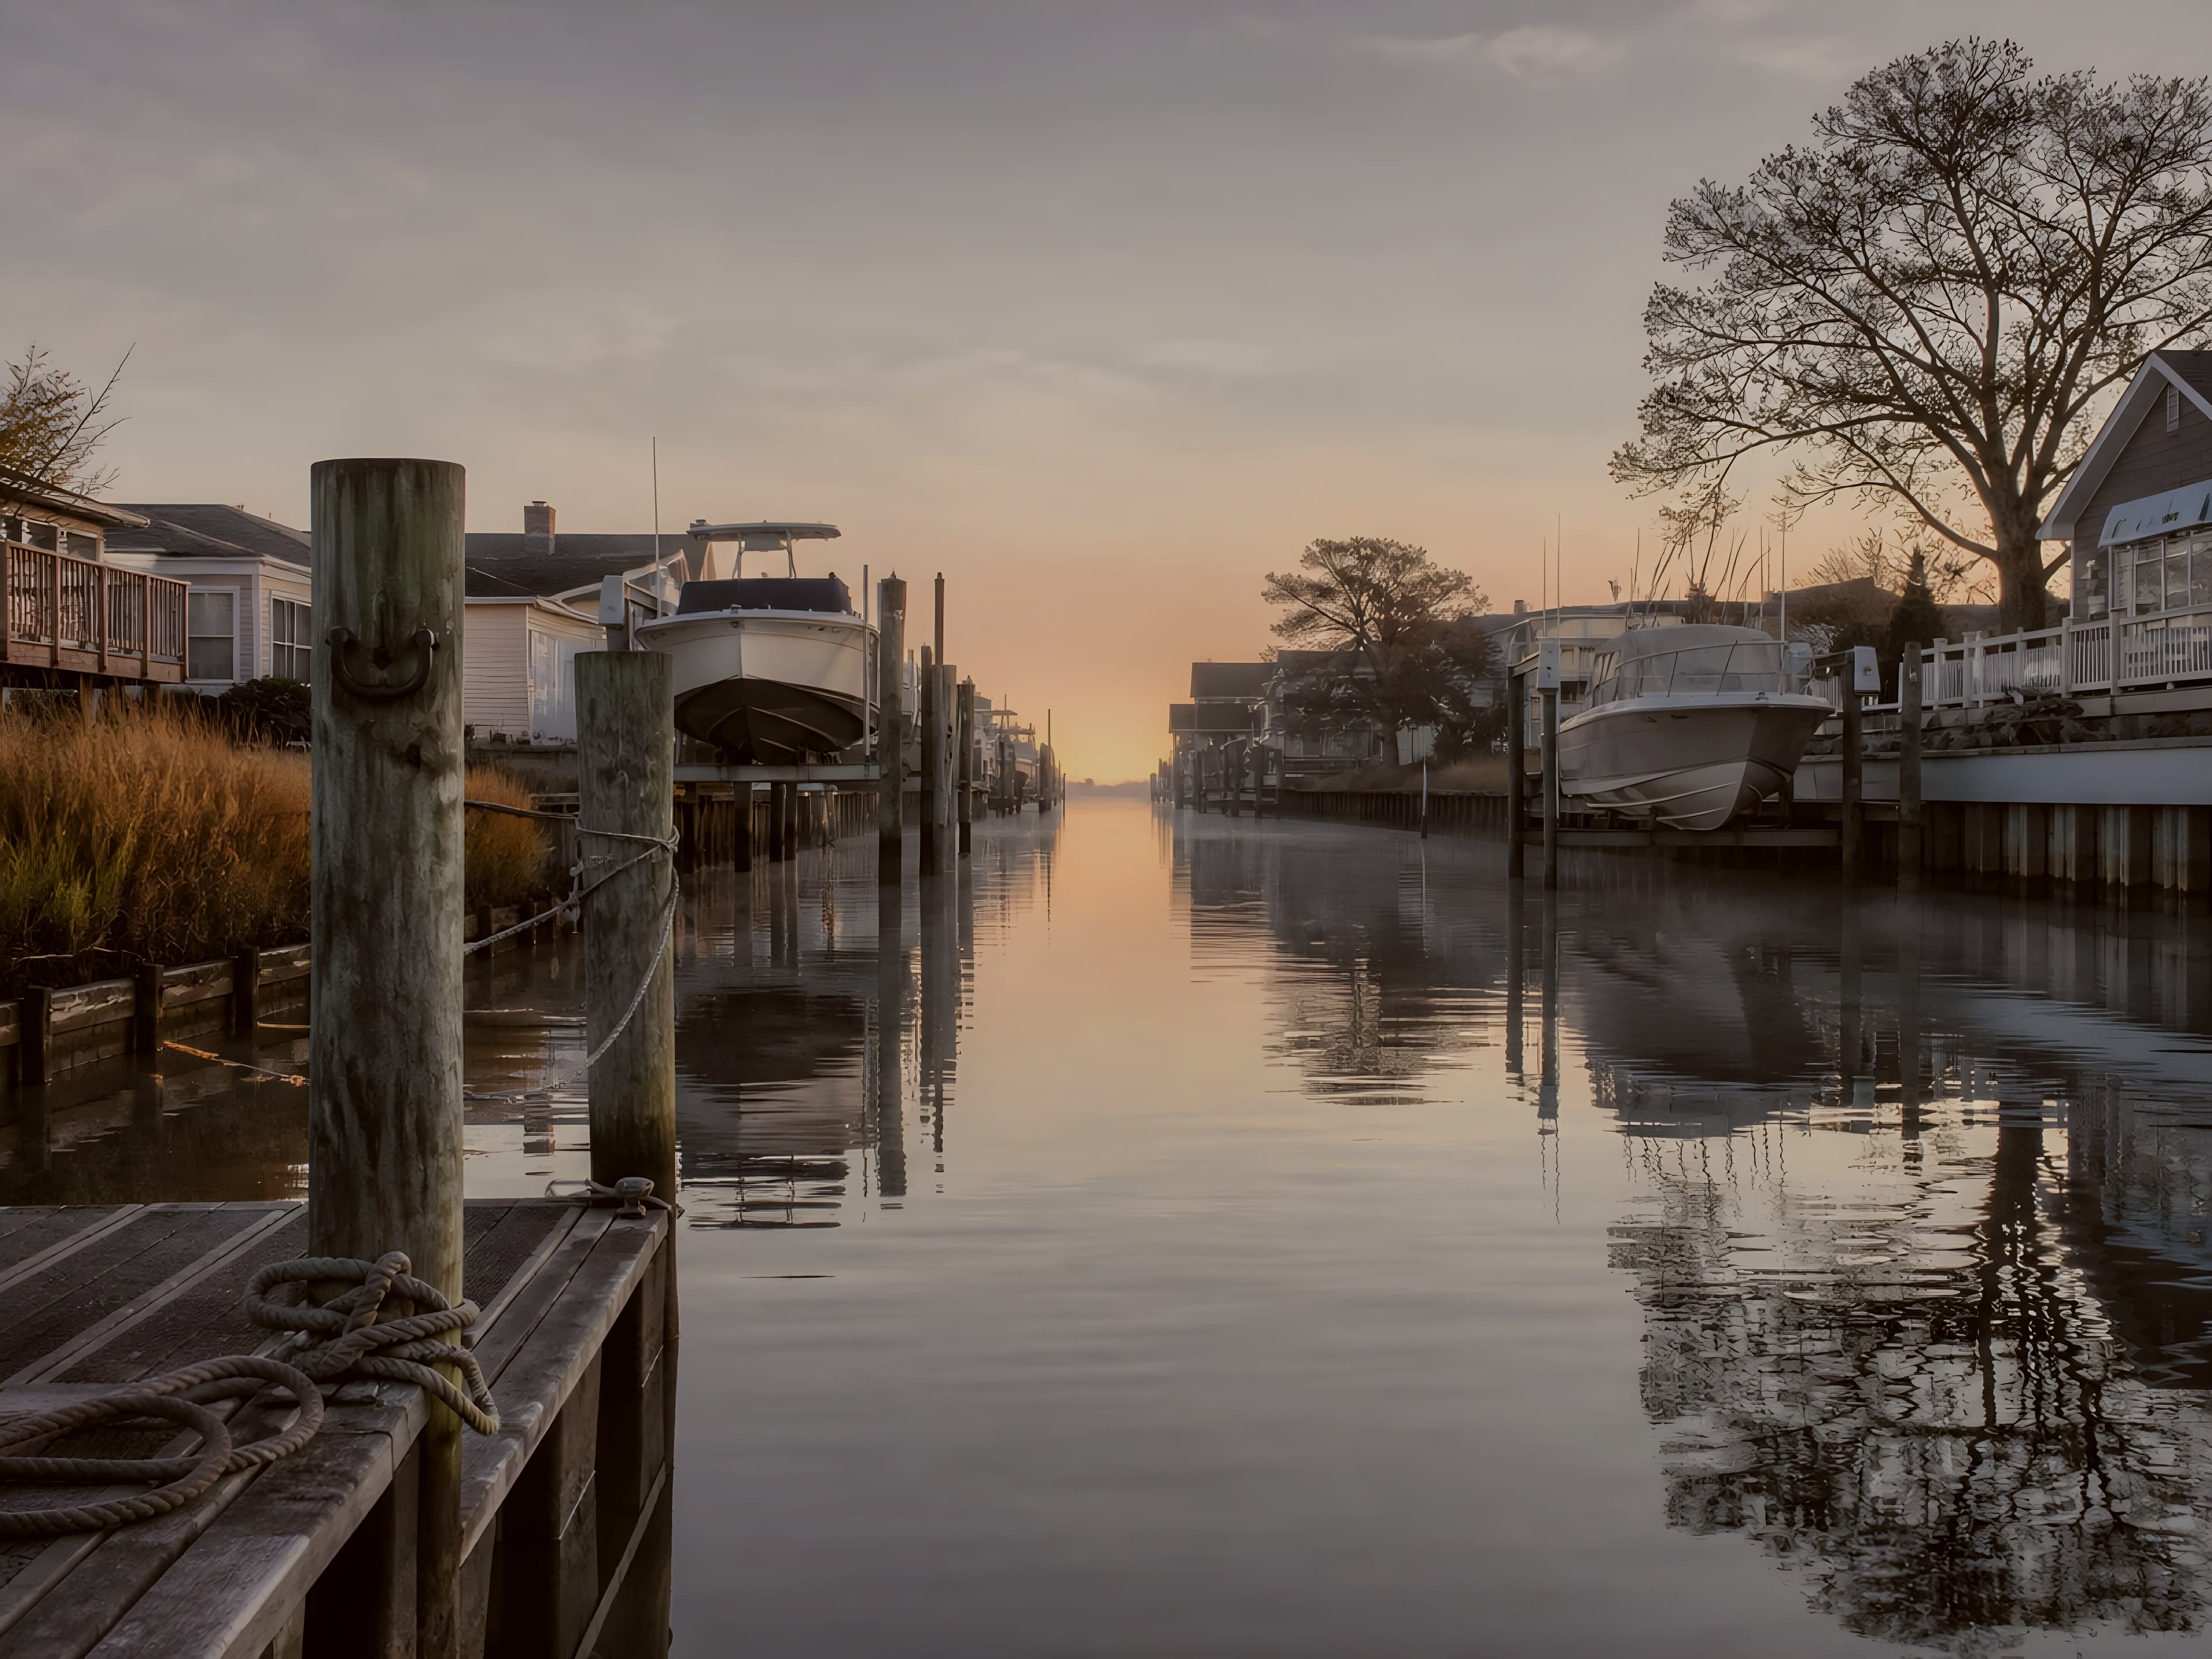
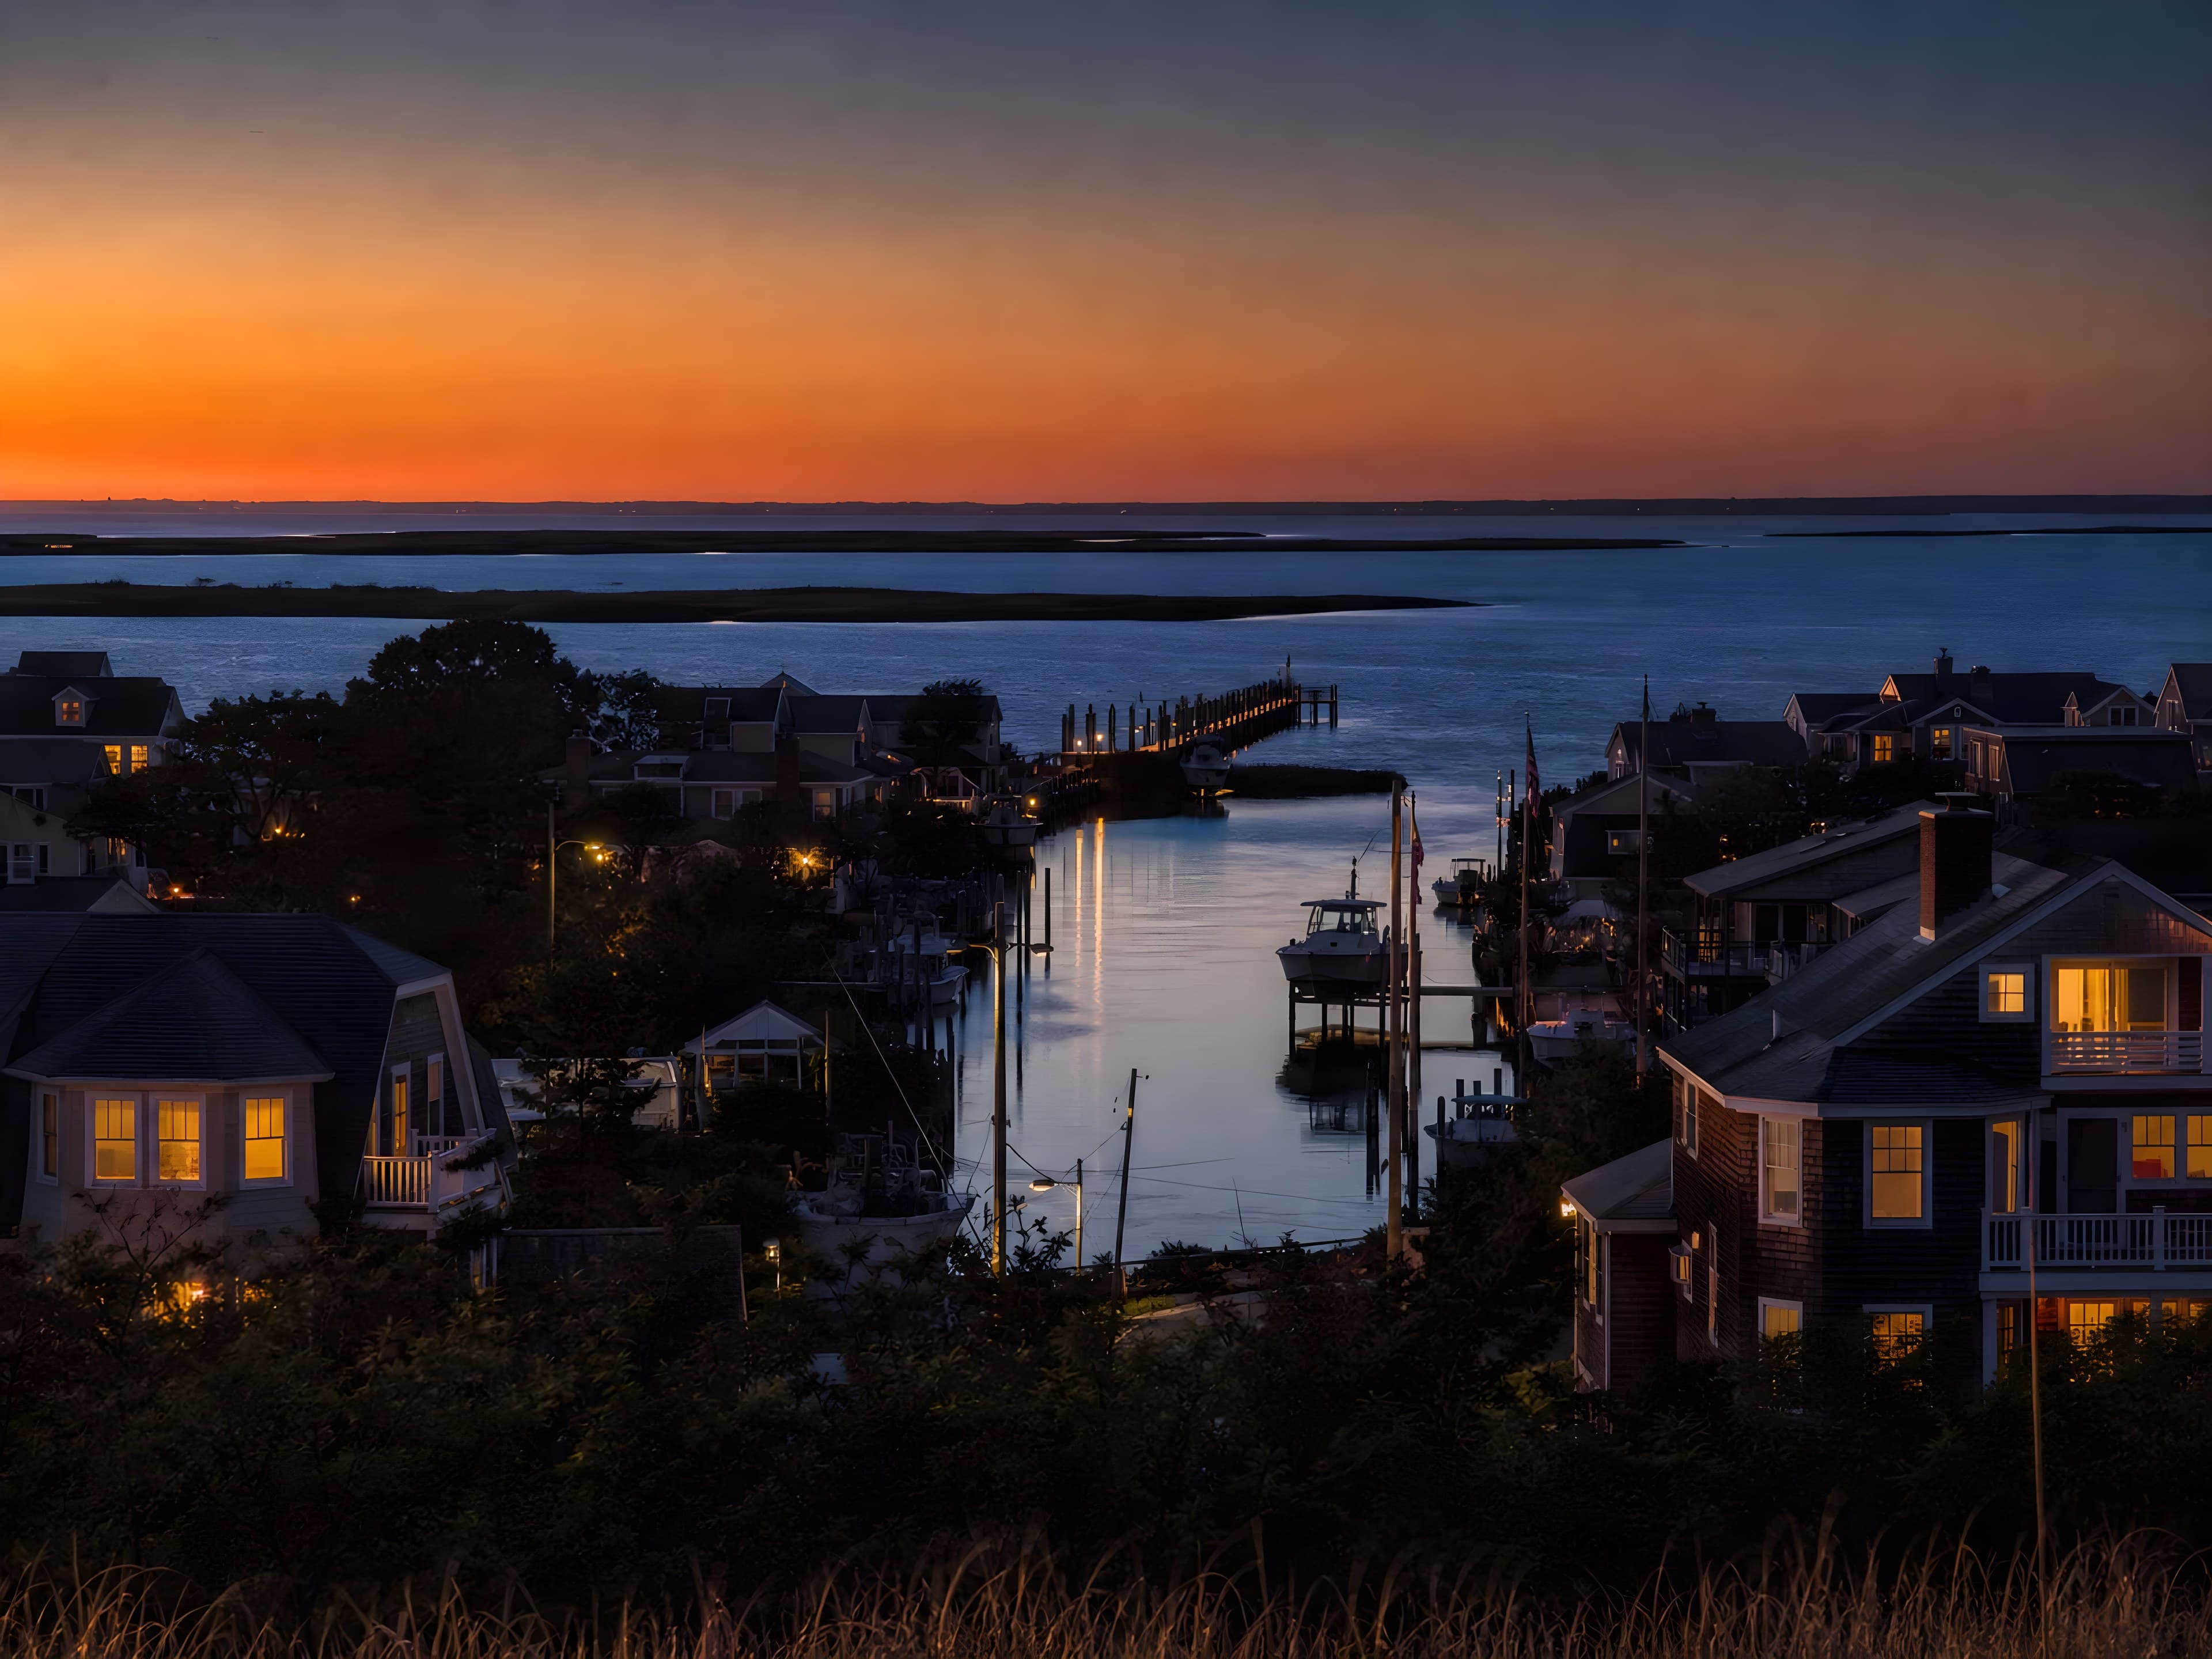
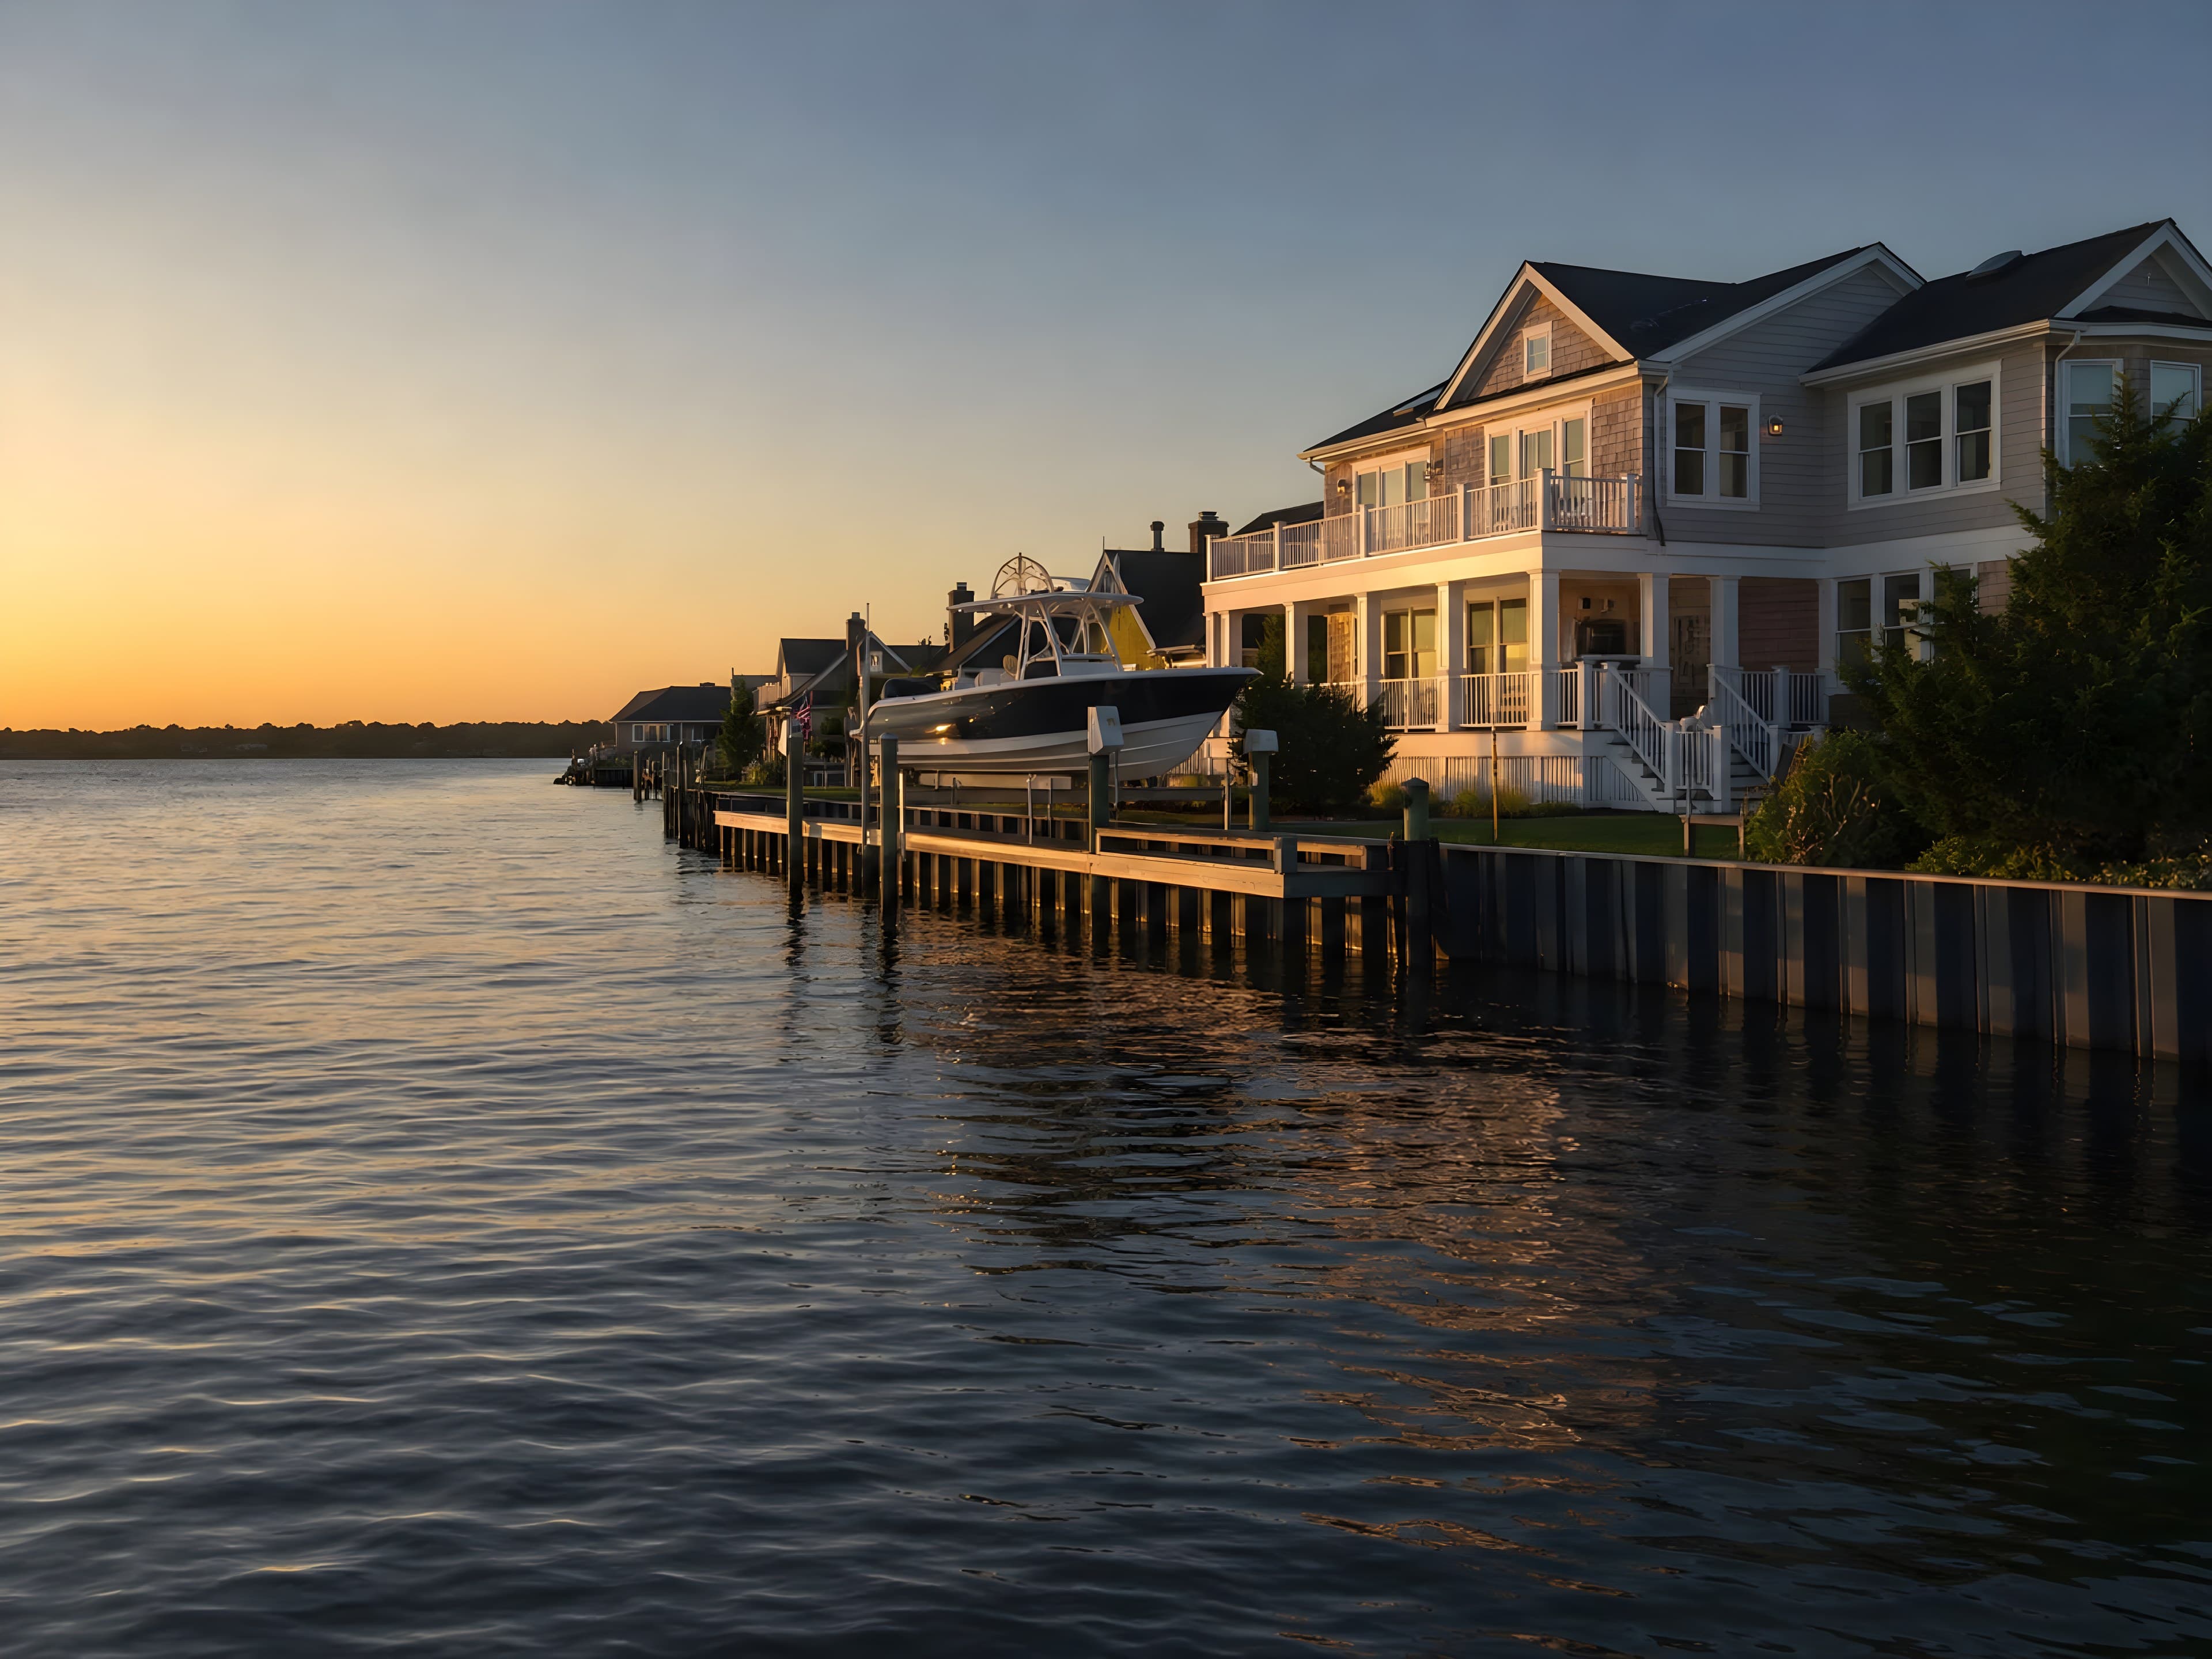
Massapequa is the quiet capital of Nassau County’s South Shore: a bayfront hamlet where a network of protected canals threads through Nassau Shores, Biltmore Shores, and Harbor Green to the open water of the Great South Bay. The finest houses here keep a boat at the bulkhead and Jones Beach fifteen minutes away, while the Babylon Branch delivers Penn Station in under fifty. Between the waterfront and the 423-acre Massapequa Preserve, it is a rare thing on Long Island: a true boating town with a serious commute.
Finding a residence in Massapequa
We search Massapequa on your behalf
We are not publishing our own listings here at present, and we would rather say so than fill the page. What we do instead is the more useful half: we search across public listings, professional member systems, broker relationships, and direct outreach. Non-public opportunities are subject to seller authorization and availability.
Tell us what you are looking for in Massapequa and you will hear from us within 24 hours.
The next step
Thinking seriously about Massapequa?
Tell us what the residence has to make possible, and we will tell you honestly whether it exists here at the price you have in mind — and what it would take if it does not.
What Sells in Massapequa
Once a month we send the closed sales in Massapequa, measured rather than estimated, with a few practical notes on the house and one thing worth knowing if you are thinking of moving.
One letter a month. Unsubscribe at any time.
A Massapequa home assessed at $1,000,000 carries
$24,974
a year, an effective rate of 2.50% of market value
- School
- $19,064
- County
- $3,040
- Town
- $2,870
Rates are levied per $1,000 of full market value and shown here against the Massapequa school district. This figure does not include special districts (fire, water, library, sanitation, ambulance); STAR, veterans, senior and other exemptions; addresses inside an incorporated village pay a separate village tax at different county and town rates. We pull the actual bill for any specific parcel before you go to contract.
Fiscal year 2025 · NYS ORPTS real property tax rates (FY2025), Socrata iq85-sdzs
The window to challenge your assessment is short, and it is the same every year
- The window to challenge your assessment opens in January
- In Nassau the filing period runs from early January to the statutory deadline of March 1, and the grievance goes to the Assessment Review Commission. The Commission has extended that date in recent years, to March 31 for the 2027/28 roll, but each extension is announced annually and is not something to count on. It costs nothing to file, and the work worth doing now is gathering what comparable houses actually sold for. Confirm the current date with the Commission before you rely on it.
Filing dates are set by statute and computed from the rule rather than quoted from a past year. Confirm the current date with the assessor before you rely on it.
Within 2 miles of Massapequa, the FEMA-mapped area in a high-risk zone is
5.1%
of mapped area, meaning Zone A or V, where a federally backed mortgage requires flood insurance
- Zone X
- 94.9%
- Zone AE
- 3.3%
- Zone VE
- 1.8%
Moderate to minimal
High risk (A/V)
High risk (A/V)
This figure does not represent the share of homes or parcels at risk in Massapequa — only the share of FEMA-mapped area within a 2-mile radius of the town's page coordinates, not a property count or a town-wide figure; the flood zone of any single address, which must be confirmed against its own FIRM panel before pricing insurance.
Queried August 2026 · FEMA National Flood Hazard Layer (NFHL), MapServer layer 28 — public, unauthenticated
Massapequa is served by the
Massapequa Union Free School District
- Enrollment
- 6,482
- Schools
- 9
- 4-Year Graduation
- 98%
Parts of North Massapequa are zoned to the Plainedge, Farmingdale, or Bethpage districts, not Massapequa UFSD — the district line matters more than the ZIP code on those blocks.
Per-pupil expenditure is not published in a form we can verify, so we do not show a figure for it.
BEDS Day enrollment 2024; graduation rate reported 2022-23 · NYSED BEDS Day enrollment file and graduation-rate/outcomes file (bulk data, data.nysed.gov)
Massapequa, as the Census Bureau measures it
| Figure | Massapequa | Nassau County |
|---|---|---|
| Median home value | $661,900 | $658,700 |
| Median gross rent | $2,500 | $2,195 |
| Median year built | 1956 | 1955 |
| Housing units | 7,472 | 477,860 |
| Owner-occupied | 97% | 82% |
| Median rooms | 7.3 | 6.6 |
| Median household income | $179,844 | $143,408 |
| Workers commuting | 9,787 | 588,204 |
These figures describe the housing, not the people who live in it, and we publish them as the Bureau measured them without interpreting them. Its own profile for Massapequa CDP, New York carries considerably more.
US Census Bureau · American Community Survey 2023 5-year estimates · Massapequa CDP, New York and Nassau County, New York
Getting to Massapequa
- LIRR
- Babylon Branch from Massapequa or Massapequa Park: about 46–50 minutes to Penn Station, 51–61 minutes to Grand Central Madison, no transfer.
- By Car
- Southern State Parkway to Midtown: roughly 45 minutes off-peak; plan 75 minutes or more at rush hour.
Watch what your home is worth
Once a month we send where your home in Massapequa stands, drawn from recorded sales nearby rather than an algorithm's guess, with the range and the sample behind it. No listing, no call, and nothing public. A person is one reply away when you want one.
Thinking of selling? Read what a home in Massapequa sells for.
Local expertise, brought to Massapequa
Anthony Clemenza leads Park & Palm's representation in Massapequa, advising buyers and sellers on positioning, pricing, and the channels through which a residence here actually reaches the market. Anthony holds an active brokerage license in New York.